A graphic organizer turns a wall of information into a shape the brain can hold: two circles for a comparison, a web for a concept, a chain of boxes for a sequence. Teachers have leaned on them for decades because they're research-backed and work in any subject at any grade. The frustration was never the diagrams. It was the filling: photocopied blanks, half-finished webs, the Venn diagram with one lonely word in the middle.
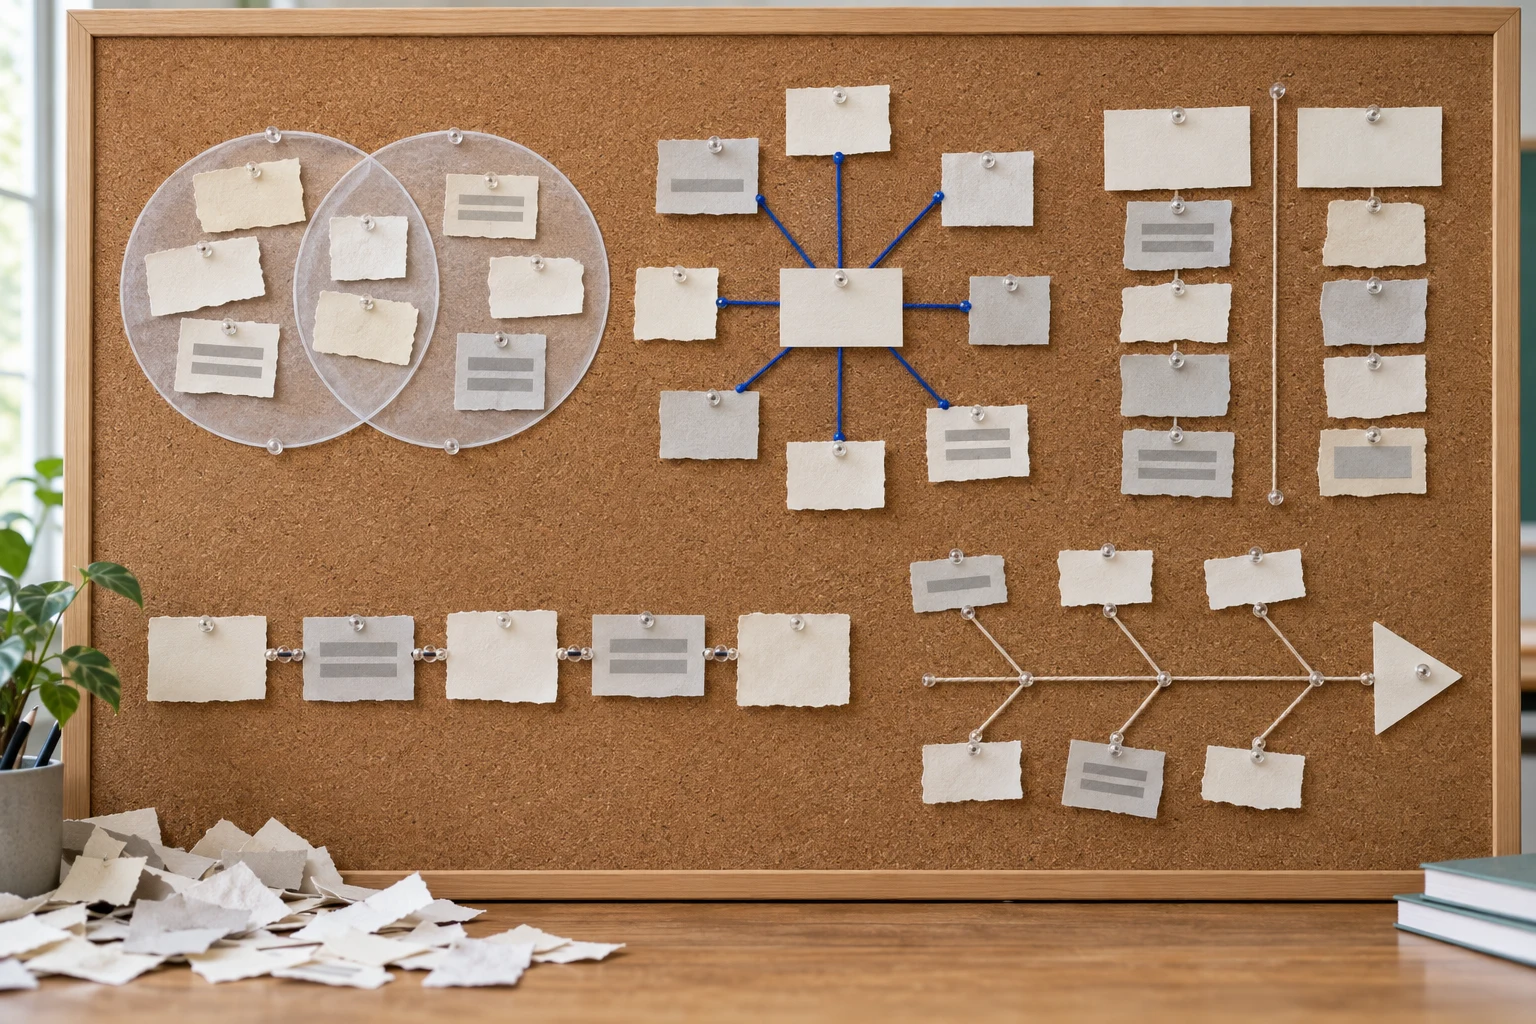
That part changed. A generator now builds the organizer from your notes, already populated, so the diagram becomes the starting point for thinking instead of homework about drawing. This guide covers the five families of graphic organizers, examples of each, and the generator that fills each one in.
The Five Families, and What Each Shape Is For
The clearest taxonomy comes from the teacher-training side, like the teaching-strategies rundown that names the core problem: students get bombarded with information and "can't make connections between the information." Each organizer family exists to make one kind of connection visible.
| Family | The shape | Classic examples | Shows you |
|---|---|---|---|
| Comparison | Overlapping circles | Venn diagram | What's shared, what's distinct |
| Concept web | Center plus branches | Mind map, spider web | How ideas relate to one theme |
| Descriptive | Columns | T-chart, KWL chart | Attributes, pros and cons |
| Sequence | Chain of boxes | Timeline, flowchart | Order and process |
| Cause and effect | Circles to boxes | Fishbone, chain diagram | Why things happened |
Those five cover the "what are the 7 types" question too: the seven-item lists split sequence into timeline and flowchart and add the T-chart's cousins.
Comparison: The Venn Diagram Earns Its Fame
Two overlapping circles, similarities in the middle. It survives because comparing is half of school: two characters, two wars, two cell types, two poems.
The Venn Diagram Generator From Notes reads your notes on both subjects and sorts what's shared into the overlap, which is precisely the sorting your brain needed to practice, now visible and checkable. And when the assignment graduates from diagram to paper, the Compare and Contrast Essay Writer turns that finished circle-sort into a structured draft. Where compare-and-contrast sits among the other assignments is mapped in our types of essays guide.
Concept Webs: Mind Maps for Radiants, Concept Maps for Relationships
The web family holds the two diagrams teachers reach for most, and the difference between them matters more than most mind map examples let on. A mind map radiates from one central idea, branches thinning as they go. A concept map is stricter: ideas connect wherever a relationship exists, and the connecting lines get labeled with what the relationship is.
- The Mind Map Generator takes a paragraph of notes and radiates it into branches, which suits brainstorming and single-topic review.
- The Concept Map Generator rebuilds a unit as labeled relationships, and its diagnostic power is the gaps: a link you can't label is a connection you don't understand yet. Why mapping beats linear notes for memory is the argument of our note-taking methods guide.
The map tools have a ceiling here. Canva, Miro and the other mind map makers draw beautiful empty boxes, and every mind map template on the internet is a prettier version of the same emptiness. The thinking is the content of the boxes, and that's the half a generator does from your actual notes.
Sequence: Timelines for History, Flowcharts for Process
Sequence organizers put time or order on paper, and this family runs deepest in our library because so many subjects are secretly sequences.
- The Timeline Generator From Notes converts any dated material into a clean chronology, and the History Notes to Timeline Converter is its history-class specialist.
- The Flowchart Generator From Notes maps decision points and branches, the shape for lab procedures, algorithms and grammar rules.
- The Process Cycle Diagram Generator handles the loops, because water, carbon, cells and seasons refuse to run in straight lines.
Cause and Effect: The Organizer That Teaches History
The cause-and-effect organizer connects cause circles to effect boxes, and the teaching-strategies video works a Revolutionary War example worth borrowing whole: British troops in Boston lead to the Boston Massacre, the Stamp Act leads to rebellion against tax collectors, Common Sense galvanizes a revolution. Three causes, three effects, one war explained in a page.
Fill one with the Graphic Organizer Generator, then let the Cause and Effect Essay Writer expand the diagram into the essay it was always the outline of.
Story Shapes: The Plot Diagram
Reading classes run on one more shape: the mountain. Exposition up the slope, climax at the peak, resolution down the other side. The Plot Diagram Generator builds it for whatever your class is reading, which turns a vague "what happened in the middle" discussion into pointing at a spot on a line. Each point on that mountain is explained in our plot diagram guide.
For Teachers: Generating the Organizer Itself
Everything above fills organizers from notes. Teachers need the other direction, a blank, well-structured organizer matched to tomorrow's lesson, and the Graphic Organizer Generator produces exactly that: pick the family, name the topic and grade, get a ready-to-print structure. Early-grade teachers building the rest of the week's printables will find them in our preschool and kindergarten setup kit.
| Source | What you get | Best for | Skip if |
|---|---|---|---|
| Template sites (Canva, HMH) | Pretty blank shapes | Consistent classroom sets | You need the boxes filled, they stay empty |
| A drawing tool (Miro, Lucidchart) | Freeform canvas | Collaborative brainstorms on a projector | The work is solo studying, the tool becomes the task |
| A generator prompt | The organizer built and populated from your material | Study review and lesson prep in minutes | Students need the practice of sorting it themselves, then generate the blank instead |
That last cell is a real pedagogical fork: filling in the organizer IS the exercise for a first encounter with material, so generate blanks for teaching and filled versions for reviewing.
Some Diagrams Are the Curriculum
A few visual organizers aren't study aids but the actual tested content, and those get dedicated practice generators: the Nitrogen Cycle and Carbon Cycle diagram generators for earth science, and the Free Body Diagram Practice Generator for physics, where drawing the arrows correctly is the exam. The arrows in food webs and the matter cycles get their own walkthrough in our food webs guide.
If your notes are too chaotic to diagram at all, the Notes Declutter Organizer is the pre-step: it sorts the pile into structure the other generators can read.
Inside the Dock Editor, the organizer output lands right beside the notes it came from, one document holding both, so the diagram and its source stay together through exam season. New accounts get a week of full access to test the whole flow.
Pick the unit you're teaching or studying Monday and run it through the matching family above: comparison gets a Venn, history gets a timeline, process gets a flowchart. One diagram per unit beats ten pages of rereading. The rest of the visual-study toolkit lives in the education prompt library.